
Suppose that we are to be presented with n distinct prizes in sequence. After being presented with a prize we must immediately decide whether to accept it or reject it and consider the next prize. The only information we are given when deciding whether to accept a prize is the relative rank of that prize compared to ones already seen. That is, for instance, when the fifth prize is presented we learn how it compares with the first four prizes already seen. Suppose that once a prize is rejected it is lost, and that our objective is to maximize the probability of obtaining the best prize. Assuming that all n! orderings of the prizes are equally likely, how well can we do?
Reference: Sheldon Ross Probability Modelling Edition 10
Below is a more detailed explanation than the text's clear yet concise approach.
Approach to the simulations for this problem
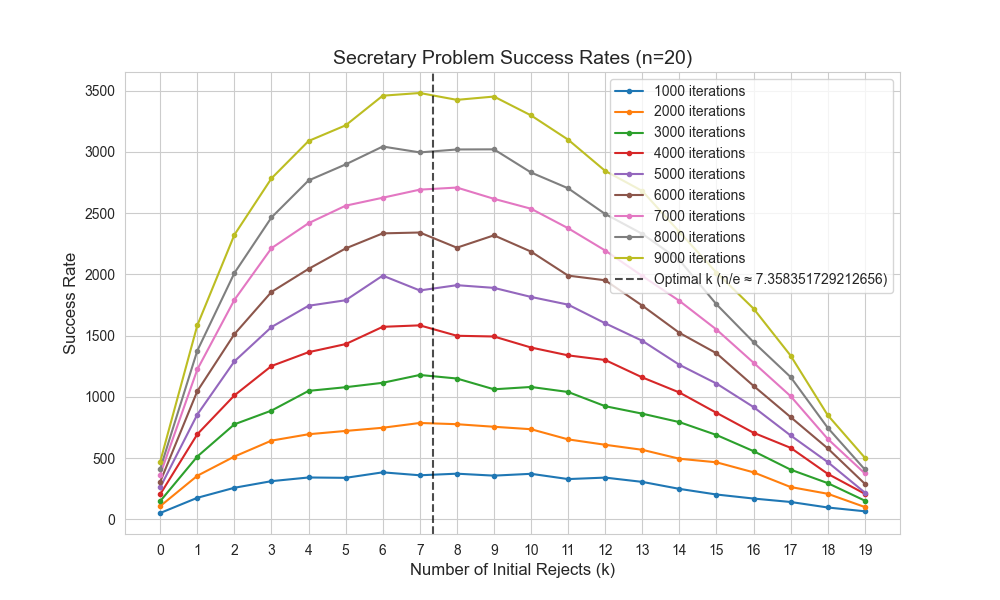
In the example below, we have \(n = 20\) and we can reject \(k\) values from \(0\) to \(19\), however, do note that after rejecting \(19\) out of the \(20\) possible options, we do will just have to accept what is left, it is not more of a choice than being left with only one choice.
import random
import pandas as pd

df_compiled = {}


n = 20
for iterations in range(1000, 10000, 1000):
    print(f"Strategy|N: {n}|Iterations: {iterations}")

    df_compiled[iterations] = {}

    for reject in range(n):


        rejected = [True] * reject + [False] * (n - reject)

        wins = []

        for _ in range(iterations):
            my_list = list(range(n))
            random.shuffle(my_list)
            df_compiled[iterations][str(reject)] = None

            df = pd.DataFrame({'index': range(n), 'prize': my_list, 'reject': rejected})

            df['cummax'] = df['prize'].cummax()
            df['new'] = (df['prize'] >= df['cummax']) & ~df['reject']

            selection = df[df['new']].head(1)
            if selection.shape[0] == 1:
                wins.append(selection['cummax'].iloc[0])
            else:
                wins.append(None)

        df_compiled[iterations][str(reject)] = wins.count(n - 1)

df_compiled = pd.DataFrame(df_compiled)


import matplotlib.pyplot as plt
import seaborn as sns

# Convert win counts to success rates
success_rates = df_compiled.copy()
for iterations in df_compiled.columns:
    success_rates[iterations] = df_compiled[iterations] / iterations

# Plot settings
plt.figure(figsize=(10, 6))
sns.set_style("whitegrid")
plt.title(f"Secretary Problem Success Rates (n={n})", fontsize=14)
plt.xlabel("Number of Initial Rejects (k)", fontsize=12)
plt.ylabel("Success Rate", fontsize=12)
plt.xticks(range(1, 9))

# Plot each iteration curve
colors = ['red', 'yellow', 'green', 'blue', 'pink', 'black', 'brown']
colors = [
    '#1f77b4', '#ff7f0e', '#2ca02c', '#d62728', '#9467bd',
    '#8c564b', '#e377c2', '#7f7f7f', '#bcbd22', '#17becf',
    '#aec7e8', '#ffbb78', '#98df8a', '#ff9896', '#c5b0d5',
    '#f7b6d2', '#d64f92', '#12aab5', '#00cc96', '#b892ff',
    '#ff9a8a', '#ffd700', '#7fffd4', '#a83c3f'
]
for i, iterations in enumerate(df_compiled.columns):
    plt.plot(
        success_rates.index.astype(int),
        df_compiled[iterations],
        marker='.',
        label=f'{iterations} iterations',
        color=colors[i]
    )

# Theoretical optimum line (n/e ≈ 3.678)
plt.axvline(x=n/2.718, color='k', linestyle='--', alpha=0.7, label=f'Optimal k (n/e ≈ {n/2.718})')
plt.legend()
plt.show()