Kresyzig Example 1.2
Question
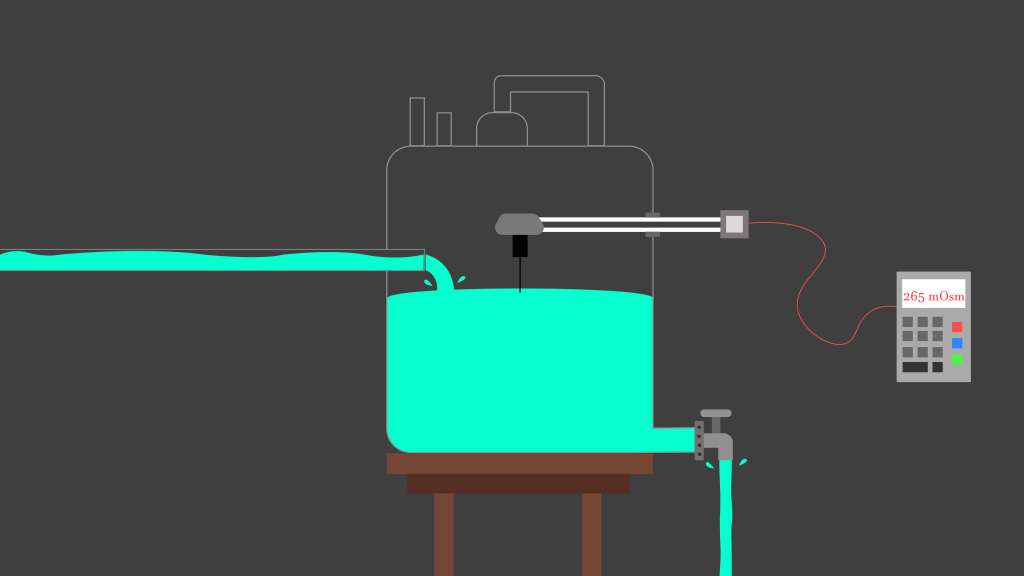
A tank contains 200 gallons of water in which 40lb of salt pounds is dissolved. Five gallons of brine each containing 2lb of dissolved salt, run into the tank per minute. The mixture is kept uniform by stirring and it runs out at the same rate (5lb per minute). Find the amount of salt dissolved in the tank at any given time.
Analytical Solution
Let y(t) is the amount of salt in the tank at any given time.- \(y(0) = 40lb\)
- \(\frac{dy_{in}(t)}{dt} = 10 \frac{lb}{min}\)
- \(\frac{dy_{out}(t)}{dt} = \frac{5}{200} y(t) \frac{lb}{min} = 0.025 y(t) \frac{lb}{min} \)
- \(\frac{dy_{net}(t)}{dt} = \frac{dy}{dt} = \frac{dy_{in}(t)}{dt} - \frac{dy_{out}(t)}{dt} = 10-0.025 y(t) = 0.025(400-y(t))\)
- \(\implies \frac{\frac{dy}{dt}}{y-400} = -0.025\)
- \(\implies \int\frac{\frac{dy}{dt}}{y-400}dt = \int-0.025 dt\)
- \(\implies \ln(y-400) = -0.025t\)
- \(y(t) = 400 - c e^{-0.025t}\)
- by using \(y(0) = 40\), we get \(c = 360\)
- and hence \(y(t) = 400 - 360 e^{-0.025t}\)
Simulation Solution
- Varying the initial value conditions: From the question, \(y(0) = 40lb\). In the plot below, we can see the \(y(t)\) vs. \(t\) for several initial value conditions. Notice how all of the conditions converge to the same infinite condition (regardless of whether \(y(0)\) is high or low)

- Initial condition with randomness :
- Let us that our measurement of the initial condition is dependent on the osmometer.
- Even if molarity of the concentration is a non-variant, the measurement itself is a variable.
- The measurement of a concentration is a Random Variable with
- the measured mean of the concentration is \( \mu(c) = c\)
- the measured standard deviation of the concentration is \( f(c) = 0.1c\)
- Plots for both the parameters are shown below

- Given that our measurement is subject to randomness as a function of the actual concentration itself, we can
collect a random sample of the measurement with an unknown concentration namely, \(c\).
- We will use this concentration to construct confidence interval functions with respect to time.
- This can be repeated with different sample sizes keeping the concentration same
- The first image below is an enlarged image for sample size = 2
- The red line is based off on the mean of the sample and the green padding surrounding it shows the 95% confidence interval around the same.
- The one below that is a mosaic for different sample sizes


Code
All the code for the analysis and the simulations is provided below.
    Module[{solutions, initials},
        initials = Range[0, 600, 40];
        solutions = Table[DSolve[{y'[t] == 10 - Divide[5, 200] y[t], y[0] == initial}, y[t], t], {initial, initials}];
        Plot[Evaluate[y[t] /. solutions]
            , {t, 0, 200}
            , ImageSize -> 788
            , PlotRange -> All
            , AspectRatio -> 1
            , Frame -> True
            , PlotLegends -> Placed[("y[0] = " <> ToString[#] & /@ initials), Below]
            , PlotLabel -> Style["y[t] vs. t", 20]
        ]
    ]

    Plot[{\[Mu], 0.5 \[Mu]}, {\[Mu], 0, 40}
        , ImageSize -> 788
        , PlotRange -> All
        , AspectRatio -> 0.5
        , Frame -> True
        , PlotLegends -> Placed[{"\[Mu](c) vs c", " \[Sigma](c) vs c"}, Below]
    ]

    Module[{solutions, sample, sampleSize = 2, initials, mean, ci},
        sample = RandomVariate[NormalDistribution[40, 0.1 * 40], sampleSize];
        mean = Mean@sample;
        ci = Divide[
            InverseCDF[StudentTDistribution[sampleSize - 1], 0.95] StandardDeviation[sample], Sqrt[sampleSize - 1]];
            initials = {mean, mean + ci, mean - ci};
      solutions = Table[DSolve[{y'[t] == 10 - Divide[5, 200] y[t], y[0] == initial}, y[t], t], {initial, initials}];
      Plot[Evaluate[y[t] /. solutions], {t, 0, 200}
        , ImageSize -> 788
        , PlotRange -> All
        , AspectRatio -> 1
        , Frame -> True
        , PlotLegends -> Placed[("y[0] = " <> ToString[#] & /@ initials[[1 ;; 1]]), Below]
        , PlotLabel -> Style["\nSample Size = " <> ToString[sampleSize], 14]
        , PlotStyle -> {Red, Lighter@Green, Lighter@Green}
        , Filling -> {2 -> {3}}]
    ]

    Framed@Grid[Partition[#, 3]] & [
        Table[
            Module[{solutions, sample, sampleSize = sampleSizeIn, initials,mean, ci},
                sample = RandomVariate[NormalDistribution[40, 0.1 * 40], sampleSize];
                mean = Mean@sample;
                ci = Divide[InverseCDF[StudentTDistribution[sampleSize - 1], 0.95] StandardDeviation[sample], Sqrt[sampleSize - 1]];
                initials = {mean, mean + ci, mean - ci};
                solutions = Table[DSolve[{y'[t] == 10 - Divide[5, 200] y[t], y[0] == initial}, y[t], t], {initial, initials}];

            Plot[
                Evaluate[y[t] /. solutions], {t, 0, 200}
                , ImageSize -> 262
                ,PlotRange -> All
                , AspectRatio -> 0.5
                , Frame -> True
                ,PlotLegends -> Placed[("y[0] = " <> ToString[#] & /@ initials[[1 ;; 1]]), Below]
                , PlotLabel -> Style["\nSample Size = " <> ToString[sampleSize], 14]
                , PlotStyle -> {Red, Lighter@Green, Lighter@Green}
                , Filling -> {2 -> {3}}]
            ],
            {sampleSizeIn, {2, 3, 4, 5, 10, 20, 25, 50, 60, 75}}
        ]
    ]