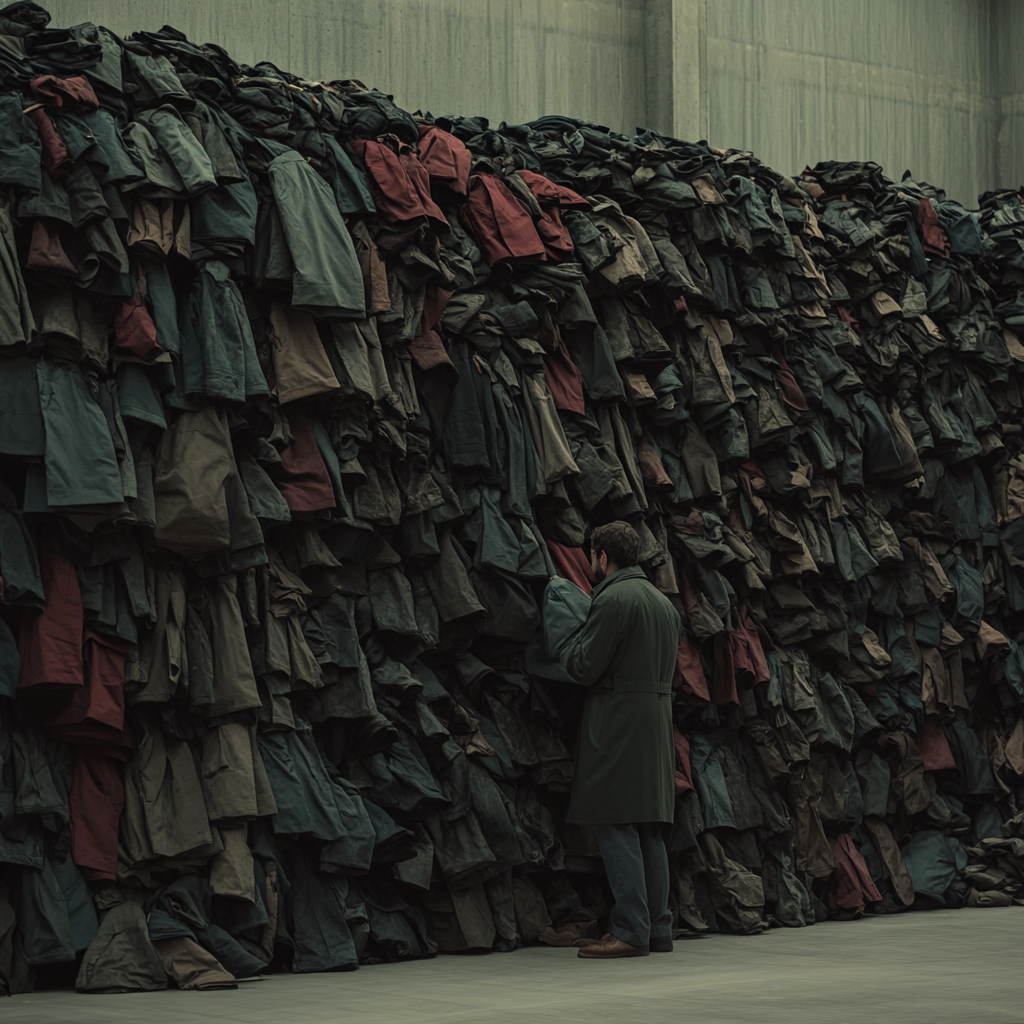
At a party N men throw their coats into the center of a room. The coats are mixed up and each man randomly selects one. Find the expected number of men who select their own coats.
Reference Sheldon Ross Probability Modelling Edition 10
Firstly let us define \(x\) as the sum of the number of men who got their coat correctly. In a group of \(n\) individuals, a person gets a \(1\) if he gets his own coat and \(0\) if not. The resultant would be the total number of men who get their own coats. \[x = \Sigma x_{i} : 1 \le i \le n\] \[E[x] = E[\Sigma x_{i}] = \Sigma E[x_{i}]\] Since each of the \(x_{i}\) is a bernoulli variable, the expectation of \(x_{i}\) is \[(1 * \frac{1}{n} ) + ( 0 * \frac{n-1}{n}) = \frac{1}{n} ⇒ \Sigma[x_{i}] = (n * \frac{1}{n}) = 1\]
We will now do a simulation of the example and see how the men get their coats when randomly choosing them.
    ClearAll[listCompare];
    listCompare[masterSample_List, randomSample_List] :=
        Module[{alphabet = masterSample, sample = randomSample},
            Table[
                If[alphabet[[n]] == sample[[n]],
                Style[sample[[n]], Darker@Green, Underlined, 15],
                Style[sample[[n]], Red, 15]],
       {n, 1, Length[sample]}]]

    Module[{alphabet = Alphabet[], scenarios = Table[RandomSample[Alphabet[], 26], 100], reSelection, tableForm},
    reSelection = {Style[#, Bold, 15] & /@ Alphabet[]}~Join~(listCompare[alphabet, #] & /@ scenarios);
    reSelection = styledStringJoin[#, " | "] & /@ reSelection;
    tableForm = TableForm@reSelection;

    Export[StringReplace[NotebookFileName[], ".nb" -> ".png"], tableForm, ImageSize -> 788, ImageResolution -> 900]]
The image below shows a simulation done with 100000 trials. The bar chart shows the counts of occurrences in which correct selections were made (if any). Out of the 100000 trials in this experiment
and so on ..
    Module[{list = Range[26], sample, barData, trials = 100000},
        sample := RandomSample[list, Length@list];
        barData = Reverse[Sort[Counts[
                        Table[Plus @@ Table[If[list[[n]] == sample[[n]], 1, 0], {n, 1, Length@list}], trials]]]];
    BarChart[barData, ChartLabels -> Keys@barData, LabelingFunction -> (Placed[#, Above] &), PlotLabel -> ToString[trials] <> " trials"]]

    Export[StringReplace[NotebookFileName[], ".nb" -> "_02.png"], %, ImageSize -> 788, ImageResolution -> 900]
The mean correct choices from this simulation is 1.0033 which is close enough to the expected value of 1.